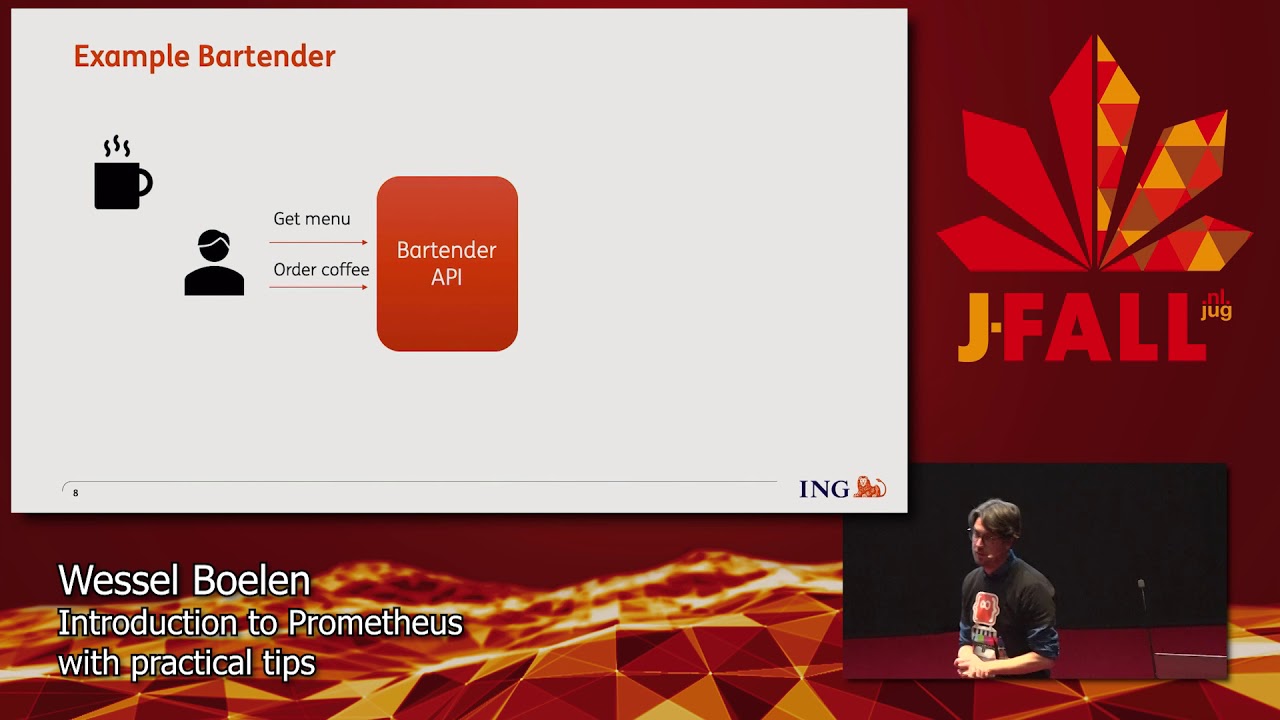
J-Fall 2019: Wessel Boelen – Introduction to Prometheus with practical tips
The goal of the session is to get the audience more familiar with monitoring and alerting using Prometheus. In a Cloud environment running multiple microservices monitoring and alerting is needed more than before. Prometheus is becoming the de facto standard. Together with Micrometer it provides a powerful tool to see how your application is behaving and being informed about problems as soon as possible.
In the first part of the session the basic concepts of dimensional metrics and the difference with older hierarchical metrics like Graphite will be explained. We will show the architecture of Prometheus and tell how all the components work together. The second part of the session is a live coding session with a simple Spring Boot application. I will add custom metrics and enable a default rich out-of-the-box set of metrics. The result will be shown in a Grafana dashboard.
Without prior knowledge, working with Prometheus may look difficult. But if you understand the basic concepts of dimensional time-based metrics it becomes really simple.